RF Explorer Files
In RF Explorer Pro model, by default files are stored in USB removable drive if available, otherwise the target directory will be “MyDocuments\RFExplorer”
Spectrum Analyzer mode
Contain different actions for files as Load, Save RFE data and Save CSV.
Overview
- RFE data files are binary, compact data files with multiple sweeps. These files are compatible with RF Explorer for Windows.
- CSV data files can capture a single trace and can be used to share data to external applications such as WWB, Excel, Matlab or IAS.
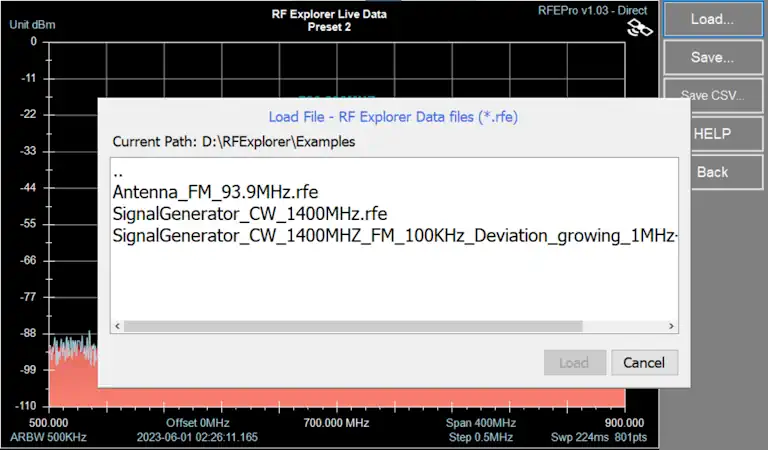
Load file
To load RFE file, go to File -> Load… and select desired file navigating through directories.
Click on [Load] button to finish action.
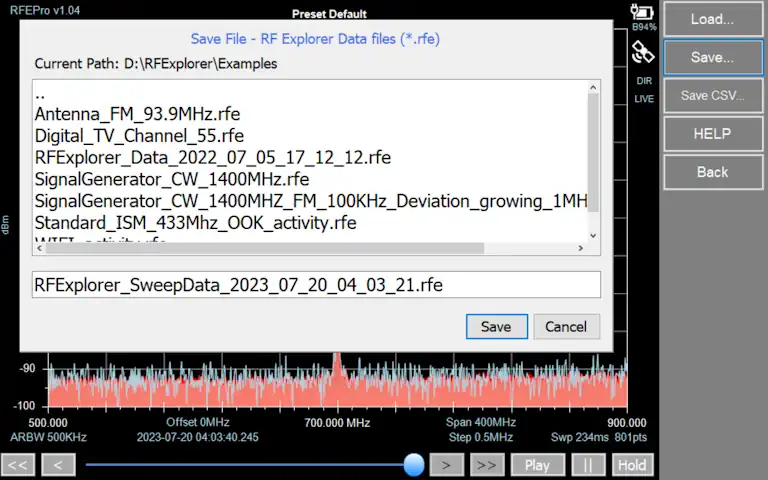
Save file
To save RFE file, go to File -> Save… and select desired directory to store file, typing a name for it.
Click on [Save] button to finish action.
This option is only available if data is actually received
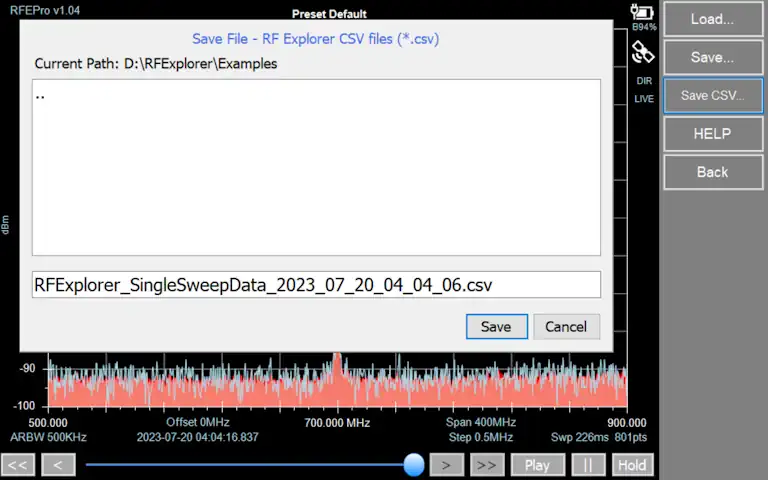
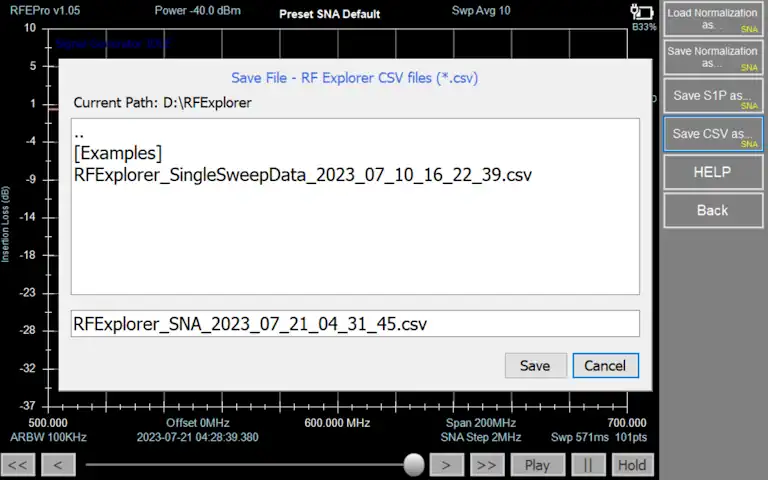
Save CSV file
To save single CSV file, go to File -> Save CSV… and select desired directory to store file, typing a name for it. Click on [Save] button to finish action.
To change CSV file configuration parameters, such as field delimiter or end of line type, see:
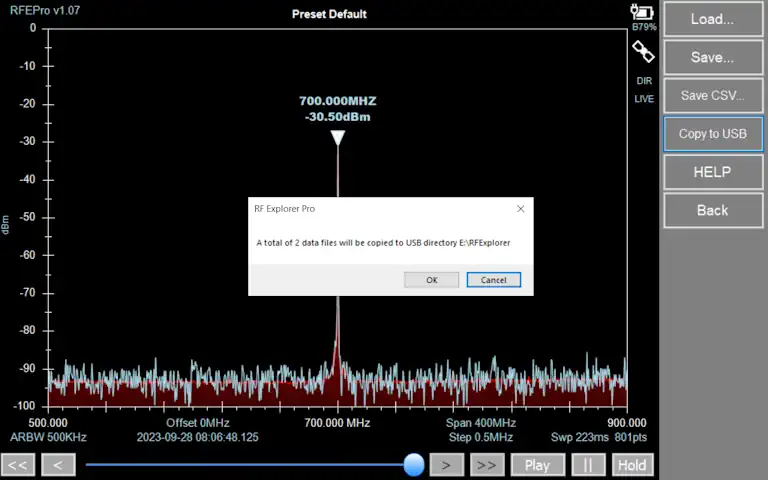
Copy to USB
This feature enables automatic exporting of the most frequently used RF Explorer files to a USB drive, allowing users to easily manage and process them later.
RF Explorer Pro model
Note
After copying the specified files to the USB drive, it will be ejected automatically and can be safely removed.
Instructions to easily export CSV files to external applications
Go to Config -> CSV File and check “WSM Sennheiser Compatible” option
Tracking SNA mode
Contain different actions for files as Load Normalization, Save Normalization, Save 1SP data and Save CSV.
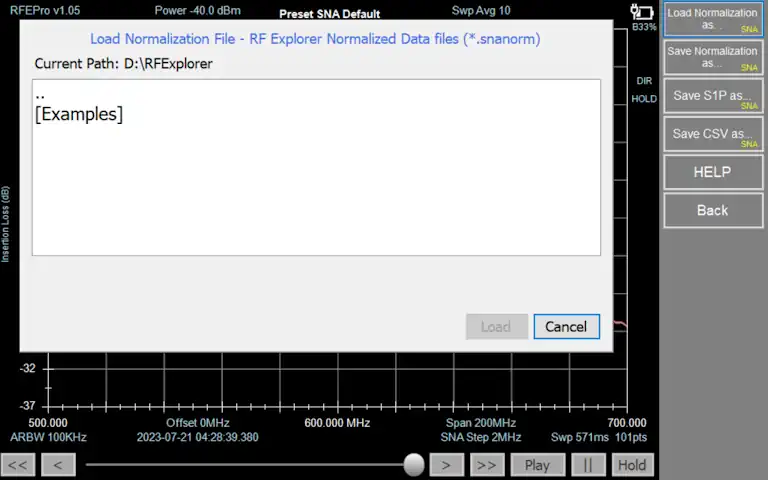
Load Normalization file
To load Normalization file, go to File -> Load Normalization as… and select desired file navigating through directories.
Click on [Load] button to finish action.
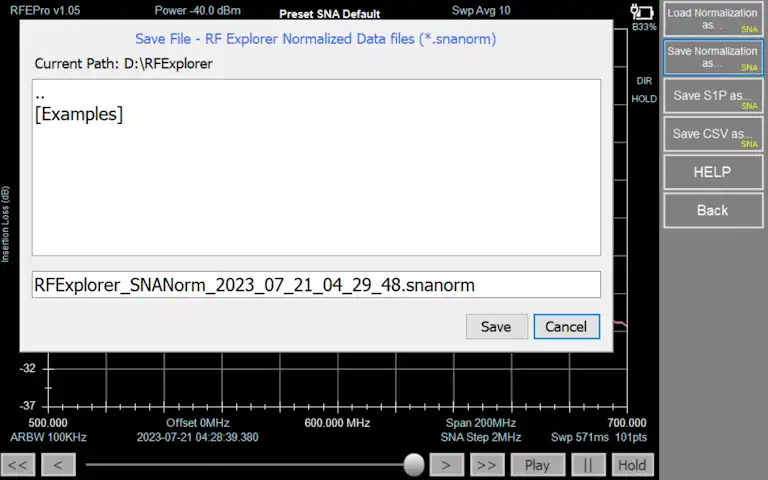
Save Normalization file
To save Normalization file, go to File -> Save Normalization as… and select desired directory to store file, typing a name for it.
Click on [Save] button to finish action.
This option is only available if tracking normalization data is actually received
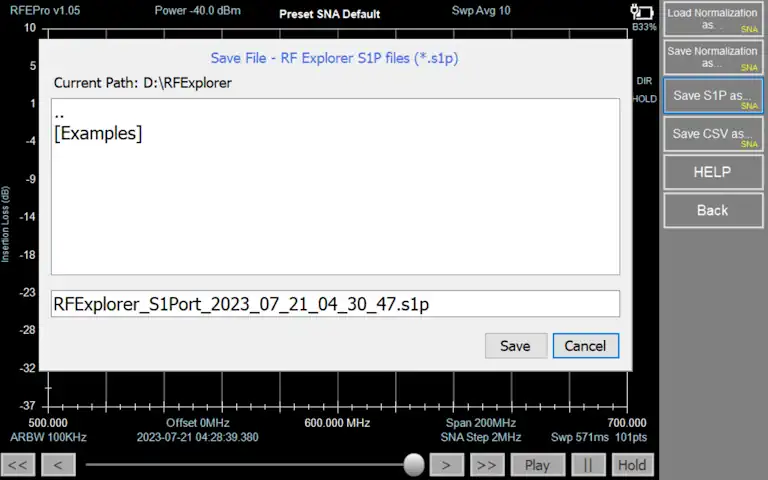
Save S1P file
One port S-parameter data file.
To save tracking S1P file, go to File -> Save S1P as… and select desired directory to store file, typing a name for it.
Click on [Save] button to finish action.
Save CSV file
To save tracking SNA single CSV file, go to File -> Save CSV… and select desired directory to store file, typing a name for it. Click on [Save] button to finish action.
To change CSV file configuration parameters, such as field delimiter or end of line type, see:
Generate GPS Heatmap file
From version v1.25, GPS Heatmap HTML files are supported for Spectrum Analyzer mode.
The Heatmap is a visual tool that represents radio frequency (RF) signal strength measurements over time and geographic location. It uses a color gradient (typically from cool colors like blue to warm colors like red) to indicate signal intensity. This allows you to quickly identify areas of strong signal (good coverage) and weak signal (poor coverage or interference).
License RFEPLIC54 Requirement for GPS Heatmap Generation
On first use, up to 10 free demo sessions are available. After that, an additional license is required to generate GPS Heatmap files.
Panel Information and adjustments
Map Adjustments Panel
Radius: Adjust the radius of the color data points on the map. A higher value makes the heatmap colors appear softer and more blended, which can help visualize general coverage trends rather than individual, sharp data points.
Min (dBm) / Max (dBm): These values define the range of the color scale. Any signal weaker than defiend Min dBm value will be shown as the minimum color (e.g., dark blue), and any signal stronger than Max dBm value will be shown as the maximum color (e.g., red). Signals within this range are represented by a gradient. You can often adjust these to focus on a specific signal strength range of interest.
Auto Set Amplitude: Automatically analyzes the current data set and adjusts the Min (dBm) and Max (dBm) values to the optimal range. This ensures the full color spectrum is used to represent your data, making the heatmap visualization as detailed and informative as possible without manual adjustment.
Reset Zoom: A button that returns the map view to its default zoom level, showing the entire surveyed route.
Save CSV: A button that exports the underlying raw or aggregated measurement data into a Comma-Separated Values (CSV) file.
Selected Data Points: This section is interactive. When you click on a specific data point or area on the heatmap, detailed information about that particular measurement (such as exact frequency, signal strength, timestamp, and GPS coordinates) will be displayed here.
Aggregation Method Selector
Average / Maximum / Minimum: This setting determines how multiple signal strength measurements taken in the same geographic area are combined into a single color on the heatmap.
- Average: Shows the mean signal strength. This is best for understanding general coverage.
- Maximum: Shows the strongest signal recorded. Useful for finding the peak performance in an area.
- Minimum: Shows the weakest signal recorded. Crucial for identifying dead spots or areas of poor coverage.
Survey Information Panel
- Total Sweeps: The total number of individual RF measurements taken during the survey.
- Aggregated Points: The number of discrete points or areas shown on the current heatmap view, which are a summary of the total sweeps.
- Device Information: Details about the RF Explorer device and input stage used to collect the data.
- Frequency Range: The specific band of the radio spectrum that was scanned.
- Start/Stop Time: The date and time (in UTC) when the survey began and ended.
- Sample Time: The interval at which measurements were automatically taken in seconds.
Route Statistics Panel
- Metric/Imperial
- This is a unit toggle switch for the displayed map and route statistics.
- Metric (km, km/h): When selected, distances are shown in kilometers (km) and speeds in kilometers per hour (km/h).
- Imperial (mi, mph): When selected, distances are shown in miles (mi) and speeds in miles per hour (mph). This allows users to view the data in their preferred measurement system.
- Total Linear Distance: The total length of the travel path during the survey
- Average Speed: The average speed during the survey
- Sample Distance: Statistics on the distance between each measurement point.
- Max / Avg / Min: The longest, average, and shortest distances between consecutive data samples.
GPS Heatmap HTML file

Note
To generate GPS Heatmap HTML files, you must capture sweep activity that includes GPS coordinate data.
Also you can load a .RFE file with captured data preivously and generate Heatmap file.
Data Point Tooltip

Selected Data Point details

Heatmap Example Files
You can download a ZIP package containing sample heatmap files to explore the application’s features.
The package also includes an activity capture with GPS data, allowing you to test and analyze location-based functionalities.